
Appearance
Performance Tips
Start with the symptom. Audio crackles, a slow editor and a sound that arrives late can have different causes. MNodes has separate readouts for audio processing, graph drawing and processing latency.
| What you notice | Start here |
|---|---|
| Crackles or dropouts during a demanding passage | Audio CPU, then buffer size |
| Dragging or zooming the graph feels slow, but audio is clean | UI Draw Time and visible displays |
| Notes or monitored audio feel late, even with a low CPU reading | Node latency and the audio buffer |
| A synth gets much heavier with chords, sustain or long releases | Voices and shared effects |
Monitor CPU usage
In Edit mode, choose View → Show Performance Stats or press Ctrl/Cmd + Alt + T. The floating Graph Stats overlay has expandable Audio, UI and Graph sections. Click a section heading to show its values.
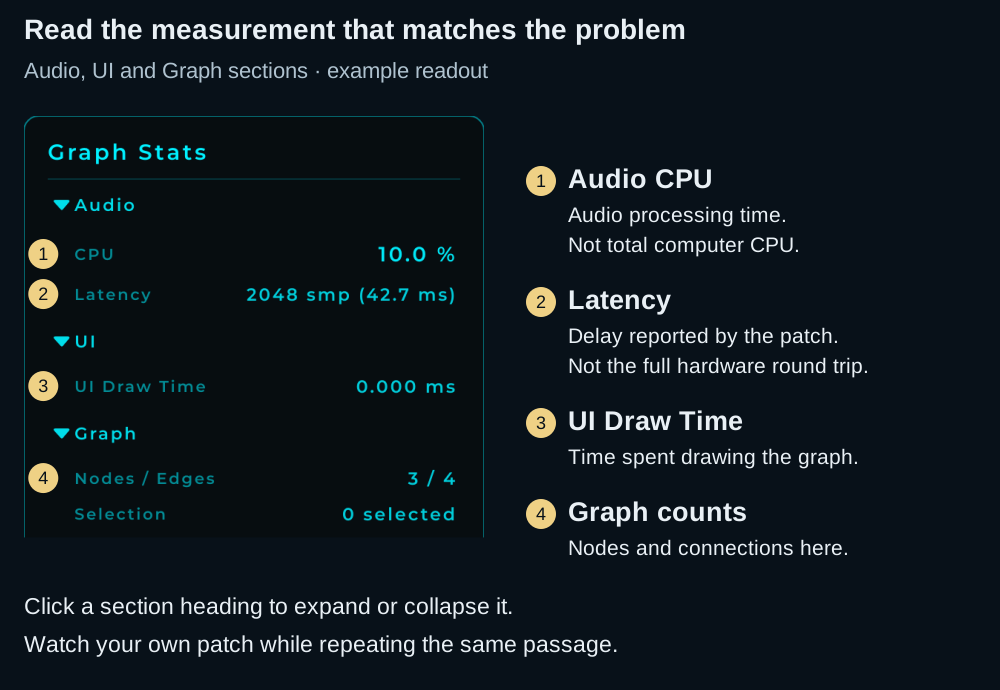
| Readout | What it tells you |
|---|---|
| Audio → CPU | How much of the available audio-block processing time this MNodes instance uses |
| Audio → Latency | The graph's reported processing delay, in samples and milliseconds |
| UI → UI Draw Time | Average measured graph drawing time in milliseconds |
| Graph → Nodes / Edges | Node and connection counts in the current graph |
| Graph → Selection | How many nodes are selected |
Audio CPU is a smoothed real-time load reading, not the operating system's total CPU percentage. A reading near 100% leaves little room to finish an audio block in time. Watch a demanding passage, not only an idle patch: a brief overload may be more noticeable in the sound than in the displayed average.
The figures on this page show an example patch. Their CPU values are not a benchmark or a target for your computer.
Find the expensive part
- Save a copy before changing a patch you want to keep.
- Play the same passage or feed the same audio each time. Keep the buffer size and sample rate unchanged while comparing nodes.
- Enable View → Show Node CPU, or Ctrl/Cmd + Alt + C. Each node header gets a small CPU badge.
- Find a busy node or container. Enter a Module or Subgraph to inspect the work inside it; a container's cost includes its internal processing.
- Change one thing: bypass an effect, lower a voice count, or simplify that part of the graph. Compare the sound and the overall Audio CPU again.
- Turn Show Node CPU off when finished. Measuring each node adds some overhead.
A coloured node badge helps you find relatively costly work. Red is a reason to investigate, not proof that the node is broken. The node and overall readings are smoothed separately, so use them for comparisons rather than expecting them to add up exactly. A value rounded to 0.0% does not mean processing is free. Do not add container and child readings together: that would count some work twice.
See where the latency comes from
Use View → Show Node Latency. Audio nodes show a latency badge in their header, including 0.0 ms when they add no reported delay. A node with no audio processing does not need that badge.
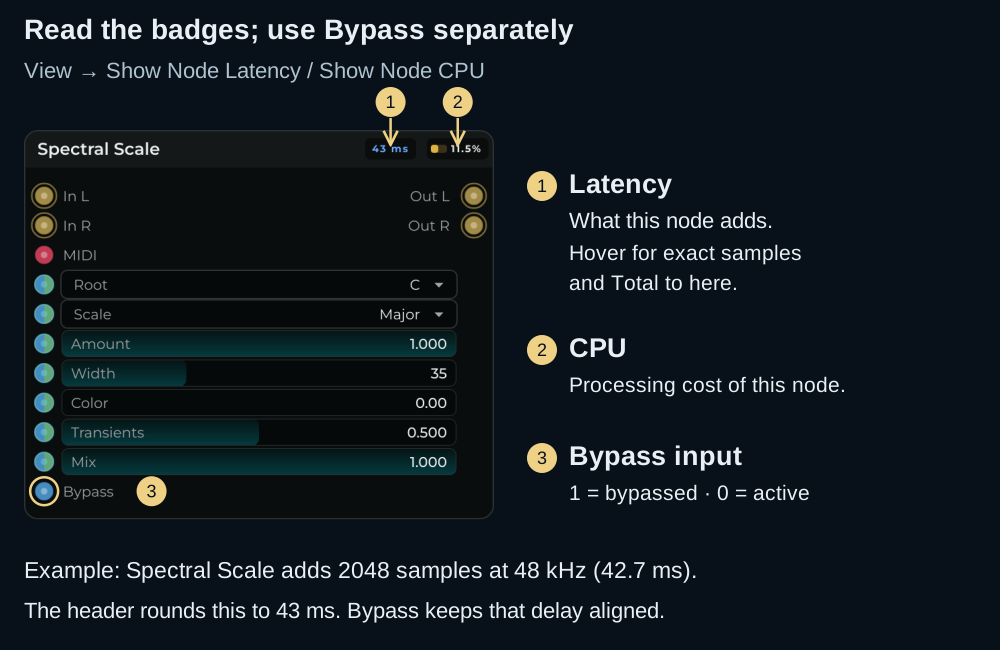
The header badge is the delay this node adds. Hover over it for a tooltip with Adds and Total to here, including exact sample counts. The total includes delay accumulated on the way to that node; it is not another delay to add to the header value.
Follow the signal path from the input toward the output. In a Module or Subgraph, enter it to look for the source of the delay. FFT-based processing, some oversampling modes, and plugins with lookahead can add latency even when CPU use is low.
Graph Stats → Latency is the patch's reported processing delay. MNodes reports it to the DAW for plugin delay compensation. It does not include the whole trip through your audio interface, driver and input/output buffers. A patch showing 0 samples can still feel late while playing.
A DAW can align recorded or played-back tracks using delay compensation; it cannot make a live note reach a delayed processor earlier. For live playing, check both the buffer and any processing that adds latency.
Also distinguish processing latency from an effect's musical timing: a delay echo of 300 ms is part of the sound, and is not necessarily reported as 300 ms of plugin compensation.
Bypass what you are not using
For a quick comparison, select a supported node in the graph and press B. Press it again to restore processing. You can also use its Bypass control in the Inspector.
To control bypass from the patch, connect a Toggle to the node's Bypass input:
| Value arriving at Bypass | Result |
|---|---|
| 1 | Bypassed |
| 0 | Active |
| An event | Toggles the current state |
Supported audio nodes expose this pin. Subgraphs, Modules and Poly Modules also expose it while empty, so you can prepare the control before building their contents. Boundary nodes such as Audio In and Audio Out do not support bypass.
For ordinary built-in audio processing, a short crossfade leads into the dry path; once the transition has settled, the wrapped audio processing stops. Routing and any compensation delay still have work to do, so bypass is cheaper without being literally zero cost.
Bypass preserves reported processing latency. MNodes delays the dry path to keep it aligned with the active path. Use bypass to compare sound and CPU; do not expect the latency number to disappear. To reduce that delay, try removing or replacing the latency-producing stage in your saved copy, then check the readout again.
Two details matter when playing:
- An effect's tail may be cut. Ordinary built-in processing restarts when re-enabled; bypass is not a promise that reverb or delay tails will carry on.
- Plugin Host has its own tail handling. Its Bypass Tails options include Cut and Ring Out. A hosted plugin can keep processing while its tail settles before sleeping, so CPU may not drop immediately.
Turning a Volume control to zero or muting a downstream output is not a reliable way to stop the processing upstream. Test the section's bypass when CPU is what you want to save.
Buffer size
The buffer sets how much audio is processed at a time. A larger buffer generally gives the system more time to meet its deadline, at the cost of a slower response when monitoring or playing live.
Set it in your DAW's audio preferences when using the plugin. In standalone, open Settings → Audio / MIDI and use the available audio-device controls. The choices depend on the driver.
At 48 kHz, these block durations are:
| Buffer | Time represented by one block |
|---|---|
| 128 samples | 2.67 ms |
| 256 samples | 5.33 ms |
| 512 samples | 10.67 ms |
| 1024 samples | 21.33 ms |
These are single-block durations, not round-trip latency measurements. Driver buffers, converters and the patch can add more delay.
For crackles, try one larger buffer setting, such as 128 → 256, and replay the same passage. Keep it if the improvement and playing response suit the task. For mixing, a larger buffer is often easier to tolerate than when recording a live instrument.
A higher sample rate means more samples to process each second and less time per block at the same buffer size. Keep it fixed during comparisons, and choose it for the session's needs rather than treating it as a CPU fix.
Heavy nodes
Measure the actual patch instead of relying on a fixed ranking of node names. The cost depends on the algorithm, settings, connections, sample rate and how often the work is repeated.
| Look for… | Try… |
|---|---|
| The same effect repeated across many voices or branches | Sharing one instance when the sound allows it |
| More voices or unison copies than the part needs | Reducing the count and replaying the densest passage |
| Oversampling on a container | Comparing its lower settings while listening for a useful difference |
| A costly hosted plugin or processing stage | A simpler mode or alternative, followed by the same CPU comparison |
| Several animated scopes or analysers | Comparing the editor with their displays hidden |
A heavy node may be exactly what the sound needs. The useful question is whether it needs to run there, that many times, and with those settings.
Connection types matter
Data carries values or events. CV and Audio carry continuously processed streams. Use Data for a value you change occasionally, such as a Knob setting Filter's Freq. Use CV when you want continuous modulation from a source such as an LFO.
A slow LFO is still a stream. Replacing CV with occasional Data updates can change the modulation, so choose the behaviour you need before comparing its cost. A dense event chain can also do significant work; Data is not automatically free.
Hybrid pins let the same destination accept either kind of control. See Data, CV and hybrid pins.
Polyphony & voices
A Poly Module runs separate audio and CV processing for its voices. More simultaneous notes, longer releases and extra unison copies can multiply the work.
Start with the smallest voice count that plays the part correctly. Test chords, sustain-pedal passages and overlapping releases; a setting that works for single notes may steal voices in the full performance.
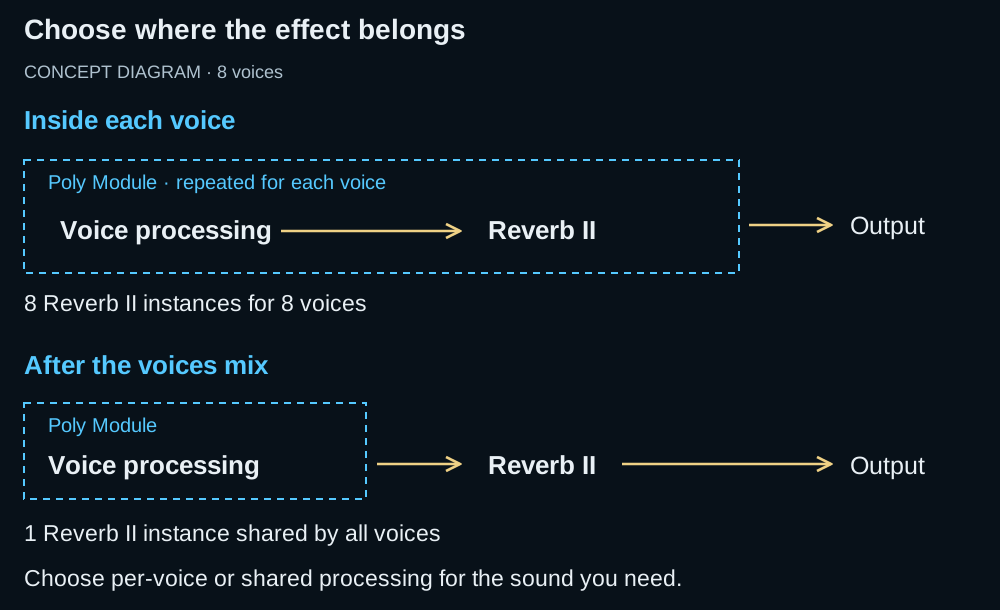
Put oscillators, a per-note filter and the voice's envelope inside the Poly Module. When all voices should share the same space, put Reverb II or another shared effect after it. This reduces the number of effect instances, but it can also change the sound; keep per-voice effects inside when that difference is intentional.
Lower the Voices setting between phrases: changing the count rebuilds the voice processing and can briefly interrupt audio. See Poly Modules for voice counts, allocation and shared Data controls.
Subgraphs & Modules
Grouping nodes makes a patch easier to navigate. It does not remove the work those nodes do.
- Organise by purpose. A voice, effect or modulation section is easier to measure and compare as a recognisable unit.
- Avoid unnecessary repetition. Several copies of a complex Module still process several copies of its contents.
- Use nesting deliberately. Container processing adds overhead; flattening everything is rarely the first place to look.
- Check Oversample. Higher factors process more samples inside the container and can add latency. Compare settings on the section that needs them.
- Bypass unused audio sections when their dry-through behaviour fits the patch.
See Subgraphs and Modules for grouping and reusable patches.
UI tricks
If the graph feels slow while audio stays clean, expand Graph Stats → UI and compare UI Draw Time while repeating the same drag or zoom.
Try hiding the Mini Map, closing unneeded analyser or scope views, and reducing how many animated node bodies are on screen. Show UI Only still draws the node's editor; it does not hide that display. Use Compact Node when you want to hide the body as well.
You can also compare the workspace with the Inspector or Explorer hidden, or switch to Perform with Ctrl/Cmd + P. The Front Panel may have animated displays of its own, so compare the actual result.
Hiding a view reduces visible drawing work; it does not automatically bypass its audio nodes. Check Audio CPU separately if crackles remain.
When everything else fails
Work on the saved copy and simplify one section at a time. Keep a version that reproduces the problem; repeatedly reopening the app is not a substitute for identifying it.
For a problem report, include:
- The smallest project that still demonstrates it, plus any required files.
- MNodes version, operating system, and standalone or DAW/plugin format.
- Sample rate and buffer size.
- The notes, audio or edit that triggers it, and whether it happens only with the editor visible.
- A screenshot of Graph Stats and the relevant node badges, if available.
For a finished DAW part, freezing or rendering the track can remove the need to process it live. Keep the editable project so you can return to it later.
If the problem is silence rather than overload, return to the signal path: Getting Started, MIDI, or DAW Integration.